Data study
Which Reddit posts rank higher in their own subreddit? What 140 million posts show
The formats, headline traits, and body lengths that rank higher in your own subreddit, among the visible posts. October 2025 through September 2026, with comparisons only made where both were comparable.
By Dmytro Krutytskyi, KissMyPost ResearchPublished Data through September 202612 min read
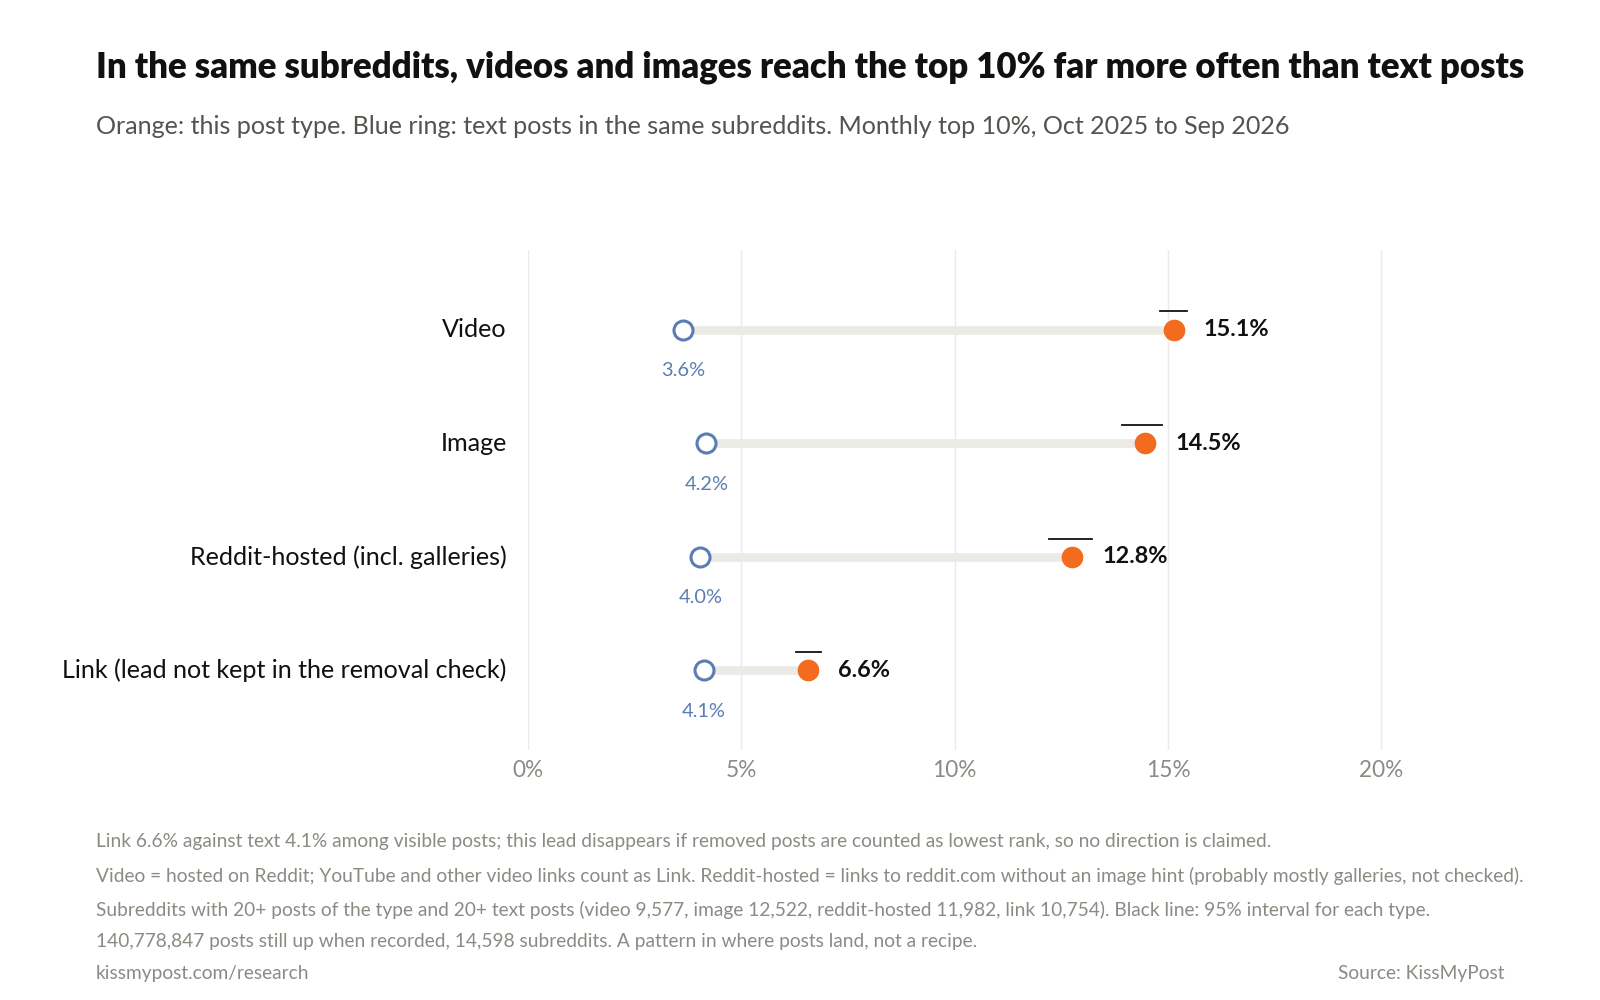
9,577 subreddits, with at least twenty Reddit-hosted video posts and twenty text posts visible during October 2025 through September 2026, were included. Visible video posts were 15.1% likely to hit the subreddit’s monthly top ten percent, compared to 3.6% for text posts. That’s a gap of 11.5 percentage points.
Check your own subreddit
See when your subreddit is most active, what gets posts removed and who writes there.
I’ve seen recurring advice on how to get upvoted on Reddit, often including tips like using “questions in headlines,” including a number in your headline, and posting a picture. I wanted to know if those things actually get you upvotes (or at least, if they show up among the things that do). So I turned to the data to find out.
In this analysis, I used 140,778,847 posts from October 2025 through September 2026, spanning 14,598 subreddits. Those are only the posts that were still visible when the source recorded them, which is usually about 36 hours after the posts were made, based on the source’s collection schedule. Only subreddits where a hundred or more of these posts were made each month were included.
Raw upvote counts aren’t very useful for comparing posts between different subreddits. But a narrower question might be: how well did a post do within its own subreddit and month?
Which posts rank higher inside their own subreddit?
Posts are percentile-ranked within each subreddit-month; being in the top 10% means they’re better than 90% of other posts in that subreddit-month.
Posts with and without a given feature are both percentile-ranked inside the same subreddit, and inside the same month. So if you have a cooking subreddit video, you only compete against other posts in that subreddit, not (say) memes elsewhere. The “score” here is the number Reddit shows next to each post, which is something like upvotes minus downvotes.
Do image and video posts rank higher than text posts?
Note that “video” here means Reddit-hosted video only; YouTube links and the like are considered links.
Video and image posts are compared to text posts of the same subreddits.
Source: KissMyPost analysis of 140,778,847 public Reddit posts in 14,598 subreddits, Oct 2025 to Sep 2026. Subreddits with 20+ posts of the type and 20+ text posts: video 9,577, image 12,522, Reddit-hosted 11,982, link 10,754. Video means video hosted on Reddit; YouTube and other video links are counted as links. Link 6.6% against text 4.1% among visible posts; this lead disappears if removed posts are counted as lowest rank, so no direction is claimed. Intervals: bootstrap over subreddits, shown for each type.
Reddit-hosted posts include galleries, reddit.com links without the image flag, but probably mostly galleries, and I haven't checked. The average percentile is close to images, but the top-10% share is a bit lower, 12.8% vs 14.5%.
It’s not just a few giant subreddits. Even excluding the ten largest subreddits, video is 4.3× as likely as text to reach the top 10%, compared to 4.2× including them. Visible video outranks visible text on average in 94.2% of subreddits where both are visible (at least 20 posts of each), compared to 95.7% for images on the same comparison.
I should say that the “claim” I’m making here, that videos are about four times as likely as text to reach the top 10%, is loose, and the raw share ratio is actually 4.2. It’s 5.3 if we require each subreddit to have at least two hundred posts of each type to qualify. And it’s 8.1 if we weight every subreddit equally. Images swing similarly.
The denominator is small here: in these subreddits, text posts reached the top 10% only 3.6% of the time. Pooled together across all subreddits, the rate for text posts rises to 5.4%. At the 200-post cutoff, the gap is 12.4 points. It’s 15.9 when subreddits are weighted equally, and 11.5 in the main comparison.
When all subreddits are pooled together and there is no matching, the multiple falls to 2.8 for video and 2.6 for images. This is pooling across subreddits, rather than within them. One possible reason, though unmeasured, is that many subreddits are mostly or only text posts.
There is one partly hidden gap here. Removed posts don’t show up in the rankings at all, but their share differs by content type.
| Post type | Posts | Removed or deleted | Share |
|---|---|---|---|
| Text | 87,628,393 | 16,733,545 | 19.1% |
| Video | 8,340,481 | 781,770 | 9.4% |
| Image | 42,274,528 | 5,358,671 | 12.7% |
| Reddit-hosted (incl. galleries) | 21,315,976 | 2,404,160 | 11.3% |
| Link | 8,378,546 | 1,880,931 | 22.4% |
Removed by a moderator, by Reddit or deleted by the author, pooled across all subreddits where each type appears, not matched inside a subreddit. The subreddit set is chosen from surviving posts, so these shares run about two points low. These posts are not in the rankings.
Within the same subreddits, the gap in removed or deleted posts between the two categories is smaller, and each community is only counted once. Video posts are removed or deleted 4.6 points less often than text posts. Image posts are removed or deleted 1.9 points less often. Link posts are removed or deleted 7.4 points more often.
For the link comparison, I only include subreddits with at least 20 posts of each format, and removed posts are counted. This fits the scenario where the lead for links fails later.
In this check, I only look at one scenario, where removed posts are ranked in their own subreddit, and removed posts rank the worst. The ranks of surviving posts do not get recomputed, and then the comparison is run again. Videos and images stay ahead of text, but links lose their lead. Links are not ranked above or below text.
Try itWhat does well in a subreddit you pick, who writes there and when to post: Subreddits
Do question marks, numbers or capital letters in a title go with higher ranks?
Titles with question marks rank lower, when looking at the same set of subreddits: images, video, links and Reddit-hosted posts have a percentile deficit of about five to six percent relative to titles without question marks. Text posts have a gap close to zero.
Here are the title features for each post type, grouped by subreddits (each subreddit is counted once).
| Title feature | Post type | Subreddits | Gap (points) | 95% interval |
|---|---|---|---|---|
| Emoji | Text | 7,144 | +0.25 | +0.08 to +0.41 |
| Emoji | Video | 4,222 | +1.29 | +1.07 to +1.50 |
| Emoji | Image | 9,144 | +2.86 | +2.72 to +3.00 |
| Emoji | Reddit-hosted (incl. galleries) | 6,460 | +3.91 | +3.76 to +4.07 |
| Emoji | Link | 1,647 | -4.51 | -4.93 to -4.08 |
| Question mark | Text | 13,290 | -0.31 | -0.38 to -0.25 |
| Question mark | Video | 5,629 | -5.08 | -5.25 to -4.90 |
| Question mark | Image | 12,123 | -5.00 | -5.11 to -4.87 |
| Question mark | Reddit-hosted (incl. galleries) | 9,927 | -6.18 | -6.33 to -6.03 |
| Question mark | Link | 4,148 | -6.16 | -6.36 to -5.93 |
| Digit | Text | 13,031 | +0.11 | +0.04 to +0.19 |
| Digit | Video | 6,326 | +0.23 | +0.08 to +0.39 |
| Digit | Image | 12,034 | +0.22 | +0.12 to +0.32 |
| Digit | Reddit-hosted (incl. galleries) | 10,226 | +0.69 | +0.56 to +0.81 |
| Digit | Link | 6,710 | +2.45 | +2.31 to +2.59 |
| Word in capitals | Text | 11,479 | +0.29 | +0.19 to +0.38 |
| Word in capitals | Video | 3,592 | -0.37 | -0.57 to -0.17 |
| Word in capitals | Image | 9,281 | -0.77 | -0.89 to -0.63 |
| Word in capitals | Reddit-hosted (incl. galleries) | 6,663 | -0.27 | -0.42 to -0.11 |
| Word in capitals | Link | 4,151 | -1.09 | -1.28 to -0.91 |
Subreddits with 20+ posts of the type both with and without the feature. Word in capitals means 4 or more Latin capital letters in a row. Digits and capitals: no overall direction; the two measures disagree for some post types, for example capitals in video and image posts.
In text posts only, the gap for question-mark is small, about a third of a point on average percentile, and 0.6 points lower in the share in the top 10%. The pooled median gap is -0.6 points, and the interval includes zero. It’s -1.3 without the 10 biggest subreddits, and that interval doesn’t include zero. One could argue either way about whether that’s practically zero; I chose the one-point cutoff after seeing the initial results, so there’s no real verdict either way.
Digits and capitalised words are each under a point on average percentile, across text, video, and image posts, including those hosted by Reddit. The exception is link posts, where digit is 2.5 points and capitals is -1.1, and they’re in the same direction in both measures.
Elsewhere, average percentile and share in the top 10% don’t always agree, such as capitals for video and image posts. So I’m not reporting an overall direction.
Do emoji and the [OC] tag go with higher ranks?
Emoji go with higher ranks in image, video and Reddit-hosted posts, about one to four points. It’s the reverse in link posts, where emoji go with lower ranks. In text posts, average percentile barely differs (a quarter of a point), but emoji raise top 10% share by 2.4 points. The measures disagree on magnitude there, so no verdict is given.
But if all posts are pooled together, the emoji gap is far bigger. Emoji titles are 8.3 points higher in median percentile. One possible unmeasured reason: Most posts with emoji aren’t text posts.
You might expect emoji to track lower ranks beforehand, but for the most part, that isn’t the case. The [OC] tag is positive across all posts, but among text posts, the sign flips. That flip rests on a handful of subreddits and a handful of live-check posts, so [OC] remains uncalled.
Does title length matter?
There are 14,598 subreddits in play, pooled together from October 2025 through September 2026, and only visible posts are included in this analysis. Titles 20 characters long or shorter reach the top 10% of their subreddit 8.4% of the time, while titles with more than 200 characters do so 10.8% of the time. Those numbers mix all post types together, so it’s not exactly like-for-like.
Here’s a look at the fraction in the top 10%, by headline length, for all subreddits combined.
Source: KissMyPost analysis of 140,778,847 public Reddit posts in 14,598 subreddits, Oct 2025 to Sep 2026. Pooled across all subreddits and post types, not matched inside a subreddit, not like-for-like. Intervals: bootstrap over subreddits.
Pooled together, the difference between the longest and shortest titles is about two points, which is small compared to the differences between different post types or subreddits. Since I’m not claiming any particular direction for this variable, I don’t think it’s worth splitting out further, but keep in mind that these pooled titles are a mix of post types and subreddits, so they aren’t directly comparable to the other analyses.
Do longer text posts rank higher?
If you look at just text posts, and compare the same subreddits, you find that 8.8% of text posts with 1,001 to 5,000 characters made it to the top 10%, versus 3.9% of text posts with 1 to 500 characters, a gap of about 4.8 percentage points (or 8.77% vs 3.93% if you don’t round up). One possible reason, which I can’t measure, is that longer posts might be of a different kind than shorter ones.
If you weight each subreddit equally, longer posts tend to average about 6.8 points ahead of shorter ones. And in almost nine of every ten subreddits (88.5%), longer posts are ahead.
Source: KissMyPost analysis of 140,778,847 public Reddit posts in 14,598 subreddits, Oct 2025 to Sep 2026. 70,894,848 text posts. Pooled across all subreddits, not matched inside a subreddit. Intervals: bootstrap over subreddits.
The pooled line dips at the very shortest posts, and then climbs back up.
How big is the posting-hour gap next to the others?
The posting hour is just being used as a yardstick here, it’s small compared to the other gaps. All subreddits pooled, the median percentile gap between the best and worst four-hour window is only 0.8 points. The gap between video and text posts, at the extremes of the post-type range, is 17.6 points. The pooled median was calculated from a histogram with two-point bins. The sub-point gap is within the precision.
Here’s the share in the top 10%, per posting hour, for subreddits pooled.
Source: KissMyPost analysis of 140,778,847 public Reddit posts in 14,598 subreddits, Oct 2025 to Sep 2026. Pooled across all subreddits, not matched inside a subreddit. Intervals: bootstrap over subreddits.
But what about timing inside one subreddit? That’s a different question. I examined those separately, and published an article on the best time to post to each subreddit on Reddit.
Can a score recorded about 36 hours after posting be trusted?
For this analysis, I used 30,000 posts from 100 randomly chosen subreddits, over three months. Within each subreddit and month, I recorded the scores and compared them to the values recorded by Reddit on November 4, 2026. Of these, 23,473 were still visible, and had a median rank correlation of 0.98 with the Reddit recorded value.
The breakdown by month follows the same pattern.
| Month | Rank correlation |
|---|---|
| November 2025 | 0.986 |
| March 2026 | 0.983 |
| July 2026 | 0.975 |
Rank correlation (Spearman) of recorded and live scores inside each subreddit-month (298 groups, 100 random subreddits).
Of these, 93.2% of the ones that were in the recorded top 10% of posts and were still visible when I checked were still in the live top 10%. (This is a count of survivors, not including posts that vanished.)
Overall, 21.8% of the sample had vanished by the time I checked. These vanished disproportionately from the bottom: roughly a third of the lowest quarter were gone, but only about an eighth of the highest quarter.
All of these findings are only for posts that survived long enough to be recorded. The ranking of posts that have vanished is unknown.
So what should you take from this?
My read is that format seems to be tracked more reliably than any particular title feature I tested, like question mark, digit, caps, or emoji, or even length. Videos and images are much more likely to hit the monthly top 10% than text, even within the same subreddit. And longer text posts tend to rank higher than shorter ones.
The presence of a question mark seems to be bad news for non-text posts.
Note that this analysis shows only what’s visible when a post lands, and says nothing about how changing some aspect of a post affects its chances of reaching that point. For example, same-subreddit photo posts vs. text posts might differ in terms of what they’re about or who wrote them.
Corrections: contact me; each fix gets a dated note on this page.
What Reddit ranking questions do you have? What data should I try to tackle next?
What this data can't tell you
| Limit | Why |
|---|---|
| Not a recipe | These are patterns in where posts land. A post's type comes bundled with its topic and its author, even inside one subreddit. If you swap your text post for a video, nothing here says what happens next. |
| Visible posts only | Removed and self-deleted posts are left out, and removal rates differ by post type. NSFW-marked posts, crossposts and known bots are left out, so this describes the rest of Reddit. Pooled across all subreddits where each type appears, about one in five text posts was removed or deleted, against about one in ten videos. Inside the same subreddits, with each subreddit counted once, the gap is smaller (4.6 points for video, 1.9 for images), and links were removed or deleted 7.4 points more often than text posts. The scenario check holds for videos and images but not for links, and it doesn't cover the opposite assumption. |
| A snapshot score | Every score is a score snapshot taken about 36 hours after posting, going by the data source's collection schedule (not checked for every post), rather than a final count. |
| Post types | The Reddit-hosted group (including galleries) is any link to reddit.com without an image hint: probably mostly galleries (not checked), plus other Reddit-hosted posts. Video means video hosted on Reddit; YouTube and other video links are counted as links, so the link group partly consists of videos. |
| No flair | The data has no post flair, so flair isn't tested. |
| Emoji detector | Emoji are counted from two Unicode ranges (checked against the Extended_Pictographic property plus the regional-indicator letters used for flags). On a sample of random titles, that pattern missed about one in twenty titles with an emoji symbol, including flags, and about one in fifty of the titles it flagged had no such symbol. |
| Literal title features only | This covers only literal features of a title: a character, a digit, a run of capital letters. Capitals means 4 or more Latin capital letters in a row, so abbreviations count and non-Latin titles are not covered. Topic, tone and curiosity aren't in here, and they may matter more. |
| No verdict | For caps and digits the two measures disagree for some post types, so there's no overall direction for them. The [OC] tag and empty text posts stay without a verdict too. |
| Big subreddits | A few huge game subreddits have millions of posts. Dropping the 10 biggest subreddits leaves the post-type and body-length gaps in the same direction (the video multiple is 4.3 instead of 4.2); some pooled title contrasts, including [OC], change. |
| Matched comparisons | The comparisons inside each subreddit were added after a look at the first, pooled results, which compared different subreddits. They use only subreddits that have both kinds of post, at least twenty of each, so they describe communities where both exist. They were run for the main window only. The pooled type comparison holds in the previous year; the matched version wasn't repeated there. |
| Tied scores | Median percentiles sit below the midpoint because of tied scores, since about two in five posts in a month have a score of one or less. That's why posts with a feature are compared with posts without it, not with the midpoint. |
| October 2025 | October 2025 looks unusual in the snapshot, with more posts lacking comments than in other months. On the pooled comparisons, dropping it leaves the post-type, question-mark, emoji and long-text directions the same; some title-length and body-length buckets change. The matched comparisons weren't repeated without it. |
| Small subreddits | Only subreddits with at least 100 posts in every month are in, so small communities aren't represented. |
| Many comparisons | 376 comparisons, most of them comparisons without a formal correction. Only the main contrasts and the within-subreddit set got a Bonferroni check; for post type and body length, only gaps that keep their direction in other cuts count as findings. The title-feature contrasts inside a post type were run for the main window only, without the cutoff and big-subreddit checks, and the pooled question-mark contrast among text posts changes when the 10 biggest subreddits are dropped. Gaps under one percentile point count as practically zero. |
Method
| Step | What |
|---|---|
| Posts | 140,778,847 public Reddit posts (70,894,848 of them text posts) in 14,598 subreddits, created October 1, 2025 to September 30, 2026. |
| Kept | Posts still visible when the data was recorded, about 36 hours after posting, going by the data source's collection schedule (not checked for every post), not marked NSFW, not pinned, not posted as a moderator, not crossposts, with a named author. Accounts on KissMyPost's list of known bots are excluded. |
| Subreddits | At least 100 such posts in each of the 12 months; user profiles don't count as subreddits. |
| Percentile | A post's mid-rank among posts of the same subreddit and month, with ties counting half. The top 10% is a score above the exact 90th percentile of that subreddit-month. |
| Post type | Fields that removal doesn't erase, in this order: text, video (video hosted on Reddit; YouTube and other video links count as links), image (an image hint or an i.redd.it or i.imgur.com link), a link to reddit.com without an image hint (Reddit-hosted, including galleries), then everything else as a link. |
| Matched comparisons | The headline comparisons are made inside each subreddit, using only subreddits with at least 20 posts of both groups. Shares are pooled over those subreddits, and the average percentile counts every subreddit once. |
| Intervals | 95% bootstrap intervals with subreddits resampled 1,000 times. |
| Average gaps | With every subreddit counted once, videos sit 22.7 points above text posts on the average percentile (22.4 to 22.9) and images 22.2 (22.0 to 22.4). |
| Other cuts | The video, image and body-length gaps were re-run with cutoffs of 50 and 100 posts, without the 10 biggest subreddits and without the single biggest, and every direction held. |
| Multiples | Video to text: 4.2 (4.0 to 4.4), 5.3 with a 200-post cutoff and 8.1 with equal weights; for images 3.5, 3.8 and 6.5. In about 18% of the subreddits in the equal-weight video comparison, no text post made the top 10%. |
| Pooled gaps | Pooled across all subreddits, not matched inside a subreddit, the median-percentile gap against text is 17.6 points for video, 13.7 for images, 13.2 for Reddit-hosted posts and 2.3 for links. |
| Scenario check | With every removed post counted as the lowest rank (ranks of surviving posts not recomputed), the matched average gap is 22.7 for video, 20.5 for images, 21.1 for Reddit-hosted posts and -0.4 for links. |
| Live check | 30,000 posts from 100 random subreddits in November 2025, March 2026 and July 2026, compared with their scores on Reddit on November 4, 2026. 23,473 were still visible. Among those, the median rank correlation (Spearman) inside 298 subreddit-months was 0.982 (0.975 to 0.986), and 93.2% (91.8% to 94.4%) of the recorded top-10% posts that were still visible stayed in the live top 10% (survivors only). The median post shifted 1.7 percentile points. On live scores, the ten pooled contrasts that could be tested kept their direction where the interval excludes zero; the within-type and body-length contrasts were not re-checked on live scores; the [OC] contrast (24 posts) did not. |
| Emoji pattern | Checked against Unicode's Extended_Pictographic property plus the regional-indicator letters used for flags (Unicode emoji technical report) on a random sample of titles from March 2026. It missed 5.2% of titles that carry one, and 1.8% of the titles it flagged had no such symbol. |
| Bonferroni check | 376 comparisons in all. A Bonferroni check, using a normal approximation from the bootstrap intervals, covered the 38 main contrasts (14 keep an interval away from zero) and the 41 within-subreddit comparisons (34 do). |
| Re-run | A separate re-run of 15 headline numbers from the written method matched them (the pooled medians within 0.3 points). Words like higher, lower or more appear only where the 95% intervals don't overlap. |
| Pooled median | Comes from a histogram in two-point bins; an exact median differs by a fraction of a point. |
Planned before looking, and found while analysing
| Guess | Result |
|---|---|
| Question marks go with lower ranks | Held for image, video, link and Reddit-hosted posts; close to zero for text |
| Images and videos rank above text in the same subreddits | Held |
| [OC] ranks higher | Unresolved |
| Emoji go with lower ranks | Rejected: slightly higher inside most types, lower for links |
| All-caps titles rank lower | Unresolved |
| The shortest titles have the lowest top-10% share, and the best length bucket reaches at least 1.3 times the share of the worst | Rejected (1.29) |
| Empty text posts rank below short ones | Unresolved |
| Digits make no difference | Close to zero inside each type, except links |
| Post type separates posts more than any title feature | Held |
| Added after the first results | The comparisons inside each subreddit (which now carry the headline numbers), the removed share by type and the scenario check, the Bonferroni check, the cutoff and weighting checks, the test of the emoji pattern and the one-point cutoff for "practically zero". The comparison of text posts with 1,001 to 5,000 characters against those with 1 to 500 was fixed after the first results; the single length buckets (1,001 to 2,000, 2,001 to 5,000 and over 5,000 characters above, 1 to 200 below) point the same way. Before the main run, a poll flag turned out to sit on images and videos too, so it was dropped, and user profiles were left out. |
Conflict of interest: KissMyPost makes Reddit research tools. Funding: none.
Questions people ask
Do longer Reddit text posts rank higher?
In October 2025–September 2026 there were 12,389 subreddits with at least twenty visible text posts of each length. Posts of 1,001–5,000 characters had 8.8% make it into the monthly top ten percent, versus 3.9% for posts of 1–500 characters. It’s possible that there’s some unmeasured factor at play here, or that longer posts are just a different kind of post.
The data
| Item | What |
|---|---|
| Files | CSV files: each post type against text posts in the same subreddits, title features inside each post type, removals by type, the pooled shares by post type, body length, title length and posting hour, the pooled title-feature gaps, the spread by feature and the live check by month. |
| Units | Shares in the series files are fractions from 0 to 1; columns marked (%) are in percent. |
| Privacy | No post text or usernames. |
| License | CC BY 4.0; credit KissMyPost, link to this page. |
- CSVPost types against text, same subredditsEach post type against text posts in subreddits with 20+ posts of both: top-10% shares (%), ratio with 95% interval, share of subreddits where the type ranks higher.
- CSVTitle features inside each post typeAverage-percentile gap for emoji, question marks, digits and words in capitals, inside each post type, each subreddit counted once, with 95% intervals.
- CSVRemoved posts by typePosts, removed or deleted posts and the share removed, by post type.
- CSVTop-10% share by post type, pooledPooled across all subreddits, not matched inside a subreddit: share of each post type in the top 10%, with 95% intervals.
- CSVTop-10% share by body length, pooledText posts, pooled across all subreddits: share in the top 10% by body length in characters, with 95% intervals.
- CSVTop-10% share by title length, pooledAll posts, pooled across all subreddits: share in the top 10% by title length, with 95% intervals.
- CSVTop-10% share by title length, text posts, pooledText posts only, pooled across all subreddits: share in the top 10% by title length, with 95% intervals.
- CSVTop-10% share by posting hour, pooledAll posts, pooled across all subreddits: share in the top 10% by posting hour (UTC), with 95% intervals.
- CSVTitle features, all posts, pooledPooled across all subreddits and post types: median-percentile gap for each title feature, with 95% intervals.
- CSVTitle features, text posts, pooledText posts only, pooled across all subreddits: median-percentile gap for each title feature, with 95% intervals.
- CSVSpread by feature, pooledPooled across all subreddits: spread of the median percentile between each feature's levels, in points.
- CSVLive check by monthMedian rank correlation of recorded and live scores inside each subreddit, by month.
- PNGMain chart, 1600 × 1000Post types against text posts in the same subreddits, as an image.
Zenodo DOI: https://doi.org/10.5281/zenodo.24142947
Check your own subreddit
See when your subreddit is most active, what gets posts removed and who writes there.
Related research
- The best time to post on Reddit, checked on 289 million postsWe checked 289M Reddit posts. A subreddit's best 4 hours gave posts a 10% better shot at its top 10%; its busiest hours, 2%. Hours by subreddit.
- Subreddit karma and account age requirements, checked on 70,483 subreddits1 in 10 of 70,483 subreddits has a karma or age minimum I found. In the typical subreddit, 49% of day-old accounts' first posts there were removed.
- Reddit AMAs by the numbers: how many, who answers, what busy threads shareHow many posts r/IAmA gets, how often the poster comments back in visible threads, and what busy threads share.
- Deleted Reddit posts: how much of Reddit do authors delete themselves?Deleted Reddit posts and comments: the share marked deleted by authors, how it differs between copies, and how many posts had a [removed] body.
About the data
KissMyPost is a Reddit analytics tool: it reads a subreddit's history (posts, comments, removals, rules) and tells you when to post, what format works and who writes there. This study uses the same data: public Reddit posts and comments back to 2005.
What KissMyPost does
About the author
Dmytro Krutytskyi is the founder of KissMyPost, a Reddit analytics tool. He studies what online communities talk about, who writes in them and how audiences overlap, and writes up what the data shows here, with the method and the numbers. Questions about the data, or need a cut we didn't publish? Write to him directly.
Cite this study
Krutytskyi, D. (2026). Which Reddit posts rank higher in their own subreddit? What 140 million posts show. KissMyPost Research. https://kissmypost.com/research/what-makes-a-reddit-post-get-upvoted
Data: Krutytskyi, D. (2026). What ranks higher on Reddit: post type, title and length, 2025-2026 [Data set]. Zenodo. https://doi.org/10.5281/zenodo.24142947