Data study
What is Reddit used for? The topics people post about, by share of posts
Subjects on Reddit, partitioned into 29 topic groups; the amount of posts (and posters) in each group. mix: drift since 2008, count's coverage of reddit as a whole
By Dmytro Krutytskyi, KissMyPost ResearchPublished Data through September 20268 min read
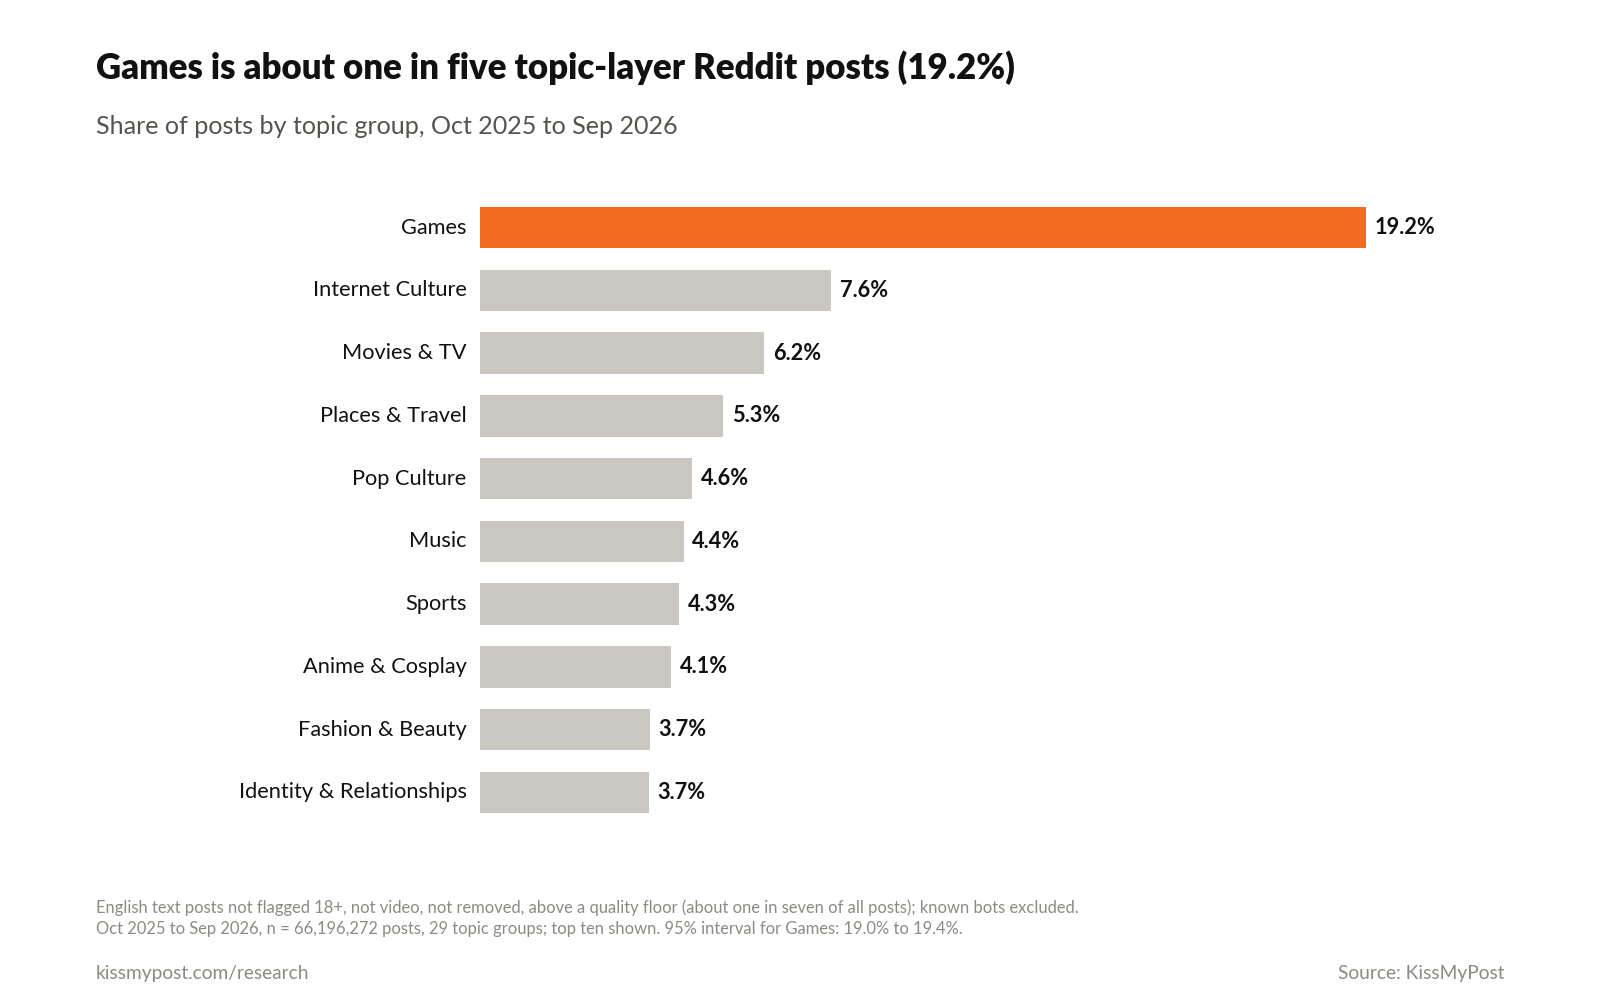
The data is English text posts, with posts flagged for being 18+ excluded, and only posts of a certain quality included. In terms of volume, the largest topic is games, which accounted for 19.2% of all posts during that period (October 2025 through September 2026). By people, 29.8% of active authors have written at least one post in the games topic.
Find subreddits like yours
Name a subreddit you know and get the communities whose posts cover the same topics, filtered by who writes there.
If you ask five people what Reddit is for, you’ll probably get five different answers: “games”, “news”, “settling a dispute about a recipe”. I think each of those answers is correct, in that they describe some subsection of Reddit. The goal of this view of Reddit is to see the whole room.
Before I show any figures, there’s a caveat I have to lay out, because it’ll frame everything that follows, so here it is up front: the data used in this article isn’t of every post on Reddit. It’s only English text posts, with no 18+ flag, no video, and wasn’t removed. And it has to pass a quality floor, which is built on votes, and is called the topic layer. This set is a minority of all posts on Reddit. You can see Reddit’s scale in the number of subreddits, and the size of the minority in the following section.
What is Reddit mostly used for?
Here are the posts split across all groups.
Source: KissMyPost analysis of public Reddit posts, Oct 2025 to Sep 2026, known bots excluded. English text posts not flagged 18+, not video, not removed, above a quality floor.
Attempts to dethrone Games have failed; it’s still first in both the first and second halves of the year. It’s still first even if you include bots in the calculation, though there aren’t that many bots in the layer (only about half a percent) so not much changes. And it’s still first even if you remove the biggest piece of the puzzle, Action Games.
After that, ordering after Games gets a lot less trustworthy, but Internet Culture is followed by Movies & TV as the next biggest topics in the layer. Note that this layer only includes posts that got some votes. One possible cause (though I can’t measure this) is that there are lots of advice and help threads that get very few votes, and those would be smaller than they really are here. Again, no position besides the top one is worth relying on.
Groups is another way to slice topics, and on this map, Internet Culture is grouped with Animals & Pets. That’s a pretty surprising grouping, but if you change the split, the order changes.
Try itThe subreddits where people in your topic actually write, found by what they talk about: Find Subs
Which topics have the most posters, not just the most posts?
posts and people are different measures, so they needn’t necessarily match; it’s possible for one person to be very active and create hundreds of posts. The number of authors is also shown.
Before I show you the next part of the data, there’s a caveat to keep in mind: an author is only counted once for each group they posted in. The average author is active in around two groups. As a result, the shares below don’t sum to one whole, and therefore can’t be compared directly with the shares for posts. They answer a different question.
Source: KissMyPost analysis of public Reddit posts, Oct 2025 to Sep 2026, known bots excluded. An author counts once in every group they posted in, so shares add up to more than the whole.
Games is again the leading topic, this time the bars represent the share of people who have written at least one post in a group on the given topic.
Try itWhat a whole group of subreddits in your topic talks about and asks for: Audiences
How has the mix of topics changed since 2012?
I was hoping that part would give me a tidy narrative, but nothing came up.
No matter what year I chose as the beginning of my look at topic layer change, games had become a bigger share of topic layer, and they’d be an even bigger share in 2025, with the difference ranging from 2.1 to 7.3 percentage points.
Here’s games versus internet culture, year by year.
Source: KissMyPost analysis of public Reddit posts, known bots excluded. The layer is selected differently in different years, so year-to-year changes mix topics with which posts get in. The year 2026 is left out as a partial year (data through September 2026).
Games’ share of the topic has increased in most years, though it dips in 2021, 2022 and 2024. Internet Culture’s share fluctuates up and down, but its shrinkage is mostly determined by what year you choose to start from. The topics that are losing ground are not ranked here.
There’s a deeper problem underneath: the pool of posts that enter this layer has changed over the years. Across all Reddit posts (excluding bots), only about a twentieth were flagged 18+ in 2012. In 2025, that share is over four-tenths, or 42.3%.
If you look at the distribution of removal marks by year, there are none for posts in 2012, but 18.8% of posts in 2025 are flagged. The mark only appears in the data starting in 2019. This gap may be partly due to an artifact of how records were kept in the past, rather than actual removals.
Both kinds of posts are excluded from this layer. There is a “mix shift” across those years, some of which is due to a change in topic and some of which is due to a change in what kinds of posts were included in the data. The data can’t tease those apart.
But games have been trending up no matter what starting year I tried, so the claim about growth seems pretty safe. The yearly figures for the other groups are in the CSV, but they shouldn’t be taken too seriously.
How much of Reddit does this cover?
Not most of Reddit. From October 2025 through September 2026, 13.4% of all posts (bots excluded) made it into the topic layer, which is about one in seven.
Where did all the posts of those months go? (Tallied under the “earliest” removing filter.)
Source: KissMyPost analysis of public Reddit posts, Oct 2025 to Sep 2026, known bots excluded. Each share is of all posts, counted once under the first filter that took the post out.
The largest category is posts that were flagged as 18+, at 37.1% of all posts. Removed or deleted posts are second. Order matters here: if a post was both removed and flagged as adult, it’s tallied under removed only, because the removing filter is applied first.
Source: KissMyPost analysis of public Reddit posts. Denominator: all posts on Reddit in the year, bots included.
This peaked at 21.6% in 2013, but has been a minority of posts every year since. These figures are for English text on Reddit only, so they don’t give a full picture of the platform. You should therefore avoid quoting any of these figures as “the share of all of Reddit”.
So what is Reddit used for?
One way to think about this is the topic layer: what people write about. Games are far ahead here. In October 2025 to September 2026, they made up around a fifth of posts. Around about three tenths of active authors have written about games at least once in that period.
The question of why people open the app can’t be answered here. All I have access to is posts and their authors, there’s nothing on people who read but don’t write. The geography of Reddit users is covered in Reddit users by country.
Find Subs, a subreddit finder to find where people who care about a particular topic hang out, is the place to find out where people interested in a particular subject post. There are other Reddit questions that could be answered with this kind of data; if you have a request for a particular question, let me know. It might just become the next installment.
What this data can't tell you
| Limit | Why |
|---|---|
| Topic layer only | The numbers describe the topic layer only, not all of Reddit: English text posts not flagged 18+, not video, not removed, above a minimum length and a quality floor. Most posts are outside it. |
| Quality floor | The layer keeps posts above a quality floor based on their votes, so posts nobody upvoted are under-represented. Groups of help and advice posts that draw few votes can look smaller than their real volume, so ranks below the first depend on these filters. |
| Clustering, no human reading | Each post is placed in a group by a clustering of its text, not by a person reading it. Group assignment accuracy was not measured: no hand check of a sample was done. The intervals show only month-to-month variation over 12 months and say nothing about assignment error. |
| Author counted in every group | An author is counted once in every group they posted in, so author shares add up to more than the whole and cannot be set against shares of posts. |
| Account ids change in 2018 | Before July 2018 account ids are hashes of names and after that numbers, so one person can be counted twice in 2018 author counts. Author shares here use only the last 12 months. |
| Not intent | A post's topic is not the reason someone opens Reddit, so this is not intent. This counts posts and posters only and says nothing about people who read without posting. |
| Selected differently in 2012 and 2025 | The layer is selected differently in 2012 and 2025: the share of posts flagged 18+ and the share with a removal mark are very different, and the layer's coverage moves from year to year. A change in the mix between years mixes a change in topics with a change in which posts get in. That's why only the Games rise, which holds from every base year tried, is described, and why falling groups are not ranked. |
| Fixed topic taxonomy | Groups follow one fixed topic taxonomy, so merging related groups would change the order. The first group is the largest group under this split, not necessarily the largest single topic. Internet Culture, for example, includes Animals & Pets. |
| Plan and results together | The plan, the code, the analysis and results were committed together, so it cannot be shown that the guesses in the Method were written down before the results were seen. |
| Still adult-themed | Posts flagged 18+ are excluded, but some groups, such as Adult Content and Mature Topics, are still adult-themed, because the flag is set per post rather than per topic. |
| First filter that removed them | In the coverage split each post is counted under the first filter that removed them from the layer, so the shares add up to all posts; an adult post that was also removed shows up only under removed. |
| July to October 2023 | A possible dip in the layer between July and October 2023 was not investigated. |
| Partial year | The year 2026 is left out of the yearly lines because it is not a full year; it is only in the 12-month window. |
Method
| Step | What |
|---|---|
| Posts | The topic layer: English text posts on Reddit, not flagged 18+, not video, not removed, above a minimum length and a vote-based quality floor, with a topic area assigned. 66,196,272 posts in the window, October 2025 through September 2026; yearly shares from 2008 to 2025. |
| Groups | 29 topic groups, the top level of KissMyPost's topic map. Each post's topic area comes from a clustering of post text, and each area belongs to one group. No language-model judges were used. |
| Bots | Accounts on KissMyPost's list of known bots (high and medium confidence) are excluded. |
| Share of posts | Posts in a group divided by all topic-layer posts in the window. The 95% confidence interval is a bootstrap over the 12 months; for Games it runs from 19.0% to 19.4%. These are full counts, so the interval shows only month-to-month variation. |
| Share of authors | Distinct authors who posted in a group at least once, divided by the 13,620,168 distinct authors in the layer in the window, with Wilson 95% confidence intervals. |
| Change over time | Each group's share of the layer by calendar year. For Games, the change to 2025 from each base year from 2011 to 2016; from 2012 it is 5.6 points. |
| Selection by year | Share of all posts (bots excluded) flagged 18+: 5.30% in 2012, 42.3% in 2025. Share with a removal or deletion mark: 0.00% in 2012, 18.8% in 2025. |
| Coverage | Layer posts divided by all posts. For the window, all posts with bots excluded, split by the first filter that removed each one. By year, all posts on the platform with bots included (13.2% in 2025). |
| Other ways | The share of the first group was re-run with bots left in, for each half of the window, and with the group's largest area (Action Games) taken out. Games stayed first in every version. |
| Comparisons | Words like largest or more appear only where 95% confidence intervals don't overlap; yearly lines are full counts without intervals, so changes between years are plain differences. |
Planned before looking, and found while analysing
| Plan | What happened |
|---|---|
| Games would be the largest group by posts | Held |
| The topic layer would cover a minority of all posts | Held |
| At least one group's share would move by more than 2 points between 2012 and 2025 | Held on paper, but only the Games change can be read, for the selection reasons in the limits table |
| Author shares would sit closer together than post shares | Dropped, because author and post shares can't be compared on a fair basis |
| Added after the first results | The selection check and the range of base years for Games, since the share of posts flagged 18+ and the share with a removal mark differ sharply between 2012 and 2025 |
| Ranking of the groups whose share fell | Dropped |
| The year 2026 in the yearly lines | Taken out as a partial year |
| Starting recipe: ranking subreddits | Its queries were replaced with ones that measure topic group shares |
| The layer's coverage as a headline number | Reported as context, since different denominators give different shares |
Conflict of interest: KissMyPost makes Reddit research tools. Funding: none.
Corrections: contact me; each fix gets a dated note on this page.
Questions people ask
What is Reddit mostly used for?
English text posts, 18+ flagged removed, passed a quality floor. Games makes up 19.2% of posts, October 2025 to September 2026, is the biggest of 29 topic groups. This shows what types of things were written about, not why people use Reddit.
How many Reddit users post about games?
This topic layer shows 29.8% of 13,620,168 active authors who wrote about games at least once during October 2025 through September 2026. Authors are tallied in all groups they belong to.
Does this show why people use Reddit?
No, this tallies posts and authors, it says nothing about people who read but didn’t post. And the topic of a post is not the reason anyone opened the app in the first place.
How much of Reddit do these numbers cover?
The topic breakdown above represents 13.4% of all posts in that time period, from October 2025 to September 2026, with bots excluded. The rest were flagged as 18+, removed/deleted, below quality floor, non-English, too short, or video.
The data
| Rank | Group | Posts | Share of posts |
|---|---|---|---|
| 1 | Games | 12,701,787 | 19.2% |
| 2 | Internet Culture | 5,034,615 | 7.6% |
| 3 | Movies & TV | 4,072,794 | 6.2% |
| 4 | Places & Travel | 3,484,490 | 5.3% |
| 5 | Pop Culture | 3,045,759 | 4.6% |
| 6 | Music | 2,920,893 | 4.4% |
| 7 | Sports | 2,862,932 | 4.3% |
| 8 | Anime & Cosplay | 2,741,434 | 4.1% |
| 9 | Fashion & Beauty | 2,436,428 | 3.7% |
| 10 | Identity & Relationships | 2,422,133 | 3.7% |
| 11 | Technology | 2,365,215 | 3.6% |
| 12 | News & Politics | 2,266,165 | 3.4% |
| 13 | Collectibles & Other Hobbies | 2,189,133 | 3.3% |
| 14 | Education & Career | 1,877,821 | 2.8% |
| 15 | Health | 1,876,835 | 2.8% |
| 16 | Reading & Writing | 1,644,252 | 2.5% |
| 17 | Art | 1,595,742 | 2.4% |
| 18 | Vehicles | 1,583,621 | 2.4% |
| 19 | Food & Drinks | 1,502,585 | 2.3% |
| 20 | Business & Finance | 1,416,310 | 2.1% |
| 21 | Home & Garden | 1,269,190 | 1.9% |
| 22 | Mature Topics | 1,167,349 | 1.8% |
| 23 | Humanities & Law | 711,166 | 1.1% |
| 24 | Q&As & Stories | 668,343 | 1.0% |
| 25 | Nature & Outdoors | 543,939 | 0.8% |
| 26 | Adult Content | 518,634 | 0.8% |
| 27 | Sciences | 513,710 | 0.8% |
| 28 | Wellness | 506,232 | 0.8% |
| 29 | Spooky | 256,765 | 0.4% |
Ranks below the first depend on the layer's filters, so read them as ranks in the topic layer only.
| Item | What |
|---|---|
| Files | Eight CSV files: groups by share of posts and by share of authors, where all posts go, the layer's coverage by year, the change from 2012 to 2025 for every group, the Games change by base year, and yearly shares for Games and Internet Culture. |
| Units | Shares are fractions between 0 and 1; changes are in percentage points. |
| Privacy | Counts only: no post text or usernames. |
| License | CC BY 4.0; credit KissMyPost, link to this page. |
- CSVGroups by share of postsAll 29 topic groups with post counts and share of topic-layer posts, October 2025 through September 2026.
- CSVGroups by share of authorsTop ten topic groups by share of active authors who posted in them at least once.
- CSVWhere all posts goAll posts of the window by the first filter that removed them, with counts and shares.
- CSVCoverage by yearShare of all Reddit posts in the topic layer, 2008 to 2025, with the yearly total.
- CSVChange by group, 2012 to 2025Each group's share in 2012 and 2025 and the change in points; the layer is selected differently in the two years.
- CSVGames change by base yearChange in the Games share to 2025 from each base year, 2011 to 2016.
- CSVGames by yearShare of topic-layer posts about games, by year.
- CSVInternet Culture by yearShare of topic-layer posts in Internet Culture, by year.
- PNGMain chart as an imageShare of topic-layer posts by topic group, as an image.
Zenodo DOI: https://doi.org/10.5281/zenodo.24238175
Find subreddits like yours
Name a subreddit you know and get the communities whose posts cover the same topics, filtered by who writes there.
Related research
- How many subreddits are there?7.8 million subreddits have had a post since 2005. 388,000 were active in September 2026, 123,000 with 10+ posts. Counts by month, year and size.
- How much of Reddit is bots? About 1 in 20 posts and comments comes from a known bot, and over half of that is AutoModeratorHow much of Reddit is bots: the share of posts and comments written by known bot accounts, by type of bot and by subreddit, from public Reddit data.
- Deleted Reddit posts: how much of Reddit do authors delete themselves?Deleted Reddit posts and comments: the share marked deleted by authors, how it differs between copies, and how many posts had a [removed] body.
- Reddit users by country: where Redditors say they liveReddit users by country, from authors who name where they live: the UK, Canada, Australia and Germany lead outside the US.
About the data
KissMyPost is a Reddit analytics tool: it reads a subreddit's history (posts, comments, removals, rules) and tells you when to post, what format works and who writes there. This study uses the same data: public Reddit posts and comments back to 2005.
What KissMyPost does
About the author
Dmytro Krutytskyi is the founder of KissMyPost, a Reddit analytics tool. He studies what online communities talk about, who writes in them and how audiences overlap, and writes up what the data shows here, with the method and the numbers. Questions about the data, or need a cut we didn't publish? Write to him directly.
Cite this study
Krutytskyi, D. (2026). What is Reddit used for? The topics people post about, by share of posts. KissMyPost Research. https://kissmypost.com/research/what-is-reddit-used-for
Data: Krutytskyi, D. (2026). Share of Reddit posts and authors by topic group, 2008-2026 [Data set]. Zenodo. https://doi.org/10.5281/zenodo.24238175